PipPeak Market Simulator · free
Practise on real market history, inside MetaTrader 5
The simulator replays real price history tick by tick. Play, pause, change speed, step bar by bar, rewind. Every sitting is journaled, and PipPeak turns it into an honest report: results in R, when you trade, how you manage the stop, how much of a winner you keep.
Four files for MetaTrader 5, one copy into your data folder. Works with the price history you already have in your terminal.
Four steps
Create a free account
The simulator is on your Downloads page the moment you sign up. No card, no trial clock.
Copy it into MetaTrader 5
Open the data folder, drag the MQL5 folder in, merge. The install video below shows every click.
Pack a dataset, once per symbol
Run the Tick Packer script on the symbol you want to practise. It turns the price history already in your terminal into a replay dataset.
Trade a sitting, upload the journal
Start the service, pick a date, press play, trade. When you stop, upload the sitting's files from your dashboard and read the report.
Install it in a few minutes
A real sitting, published as it came out
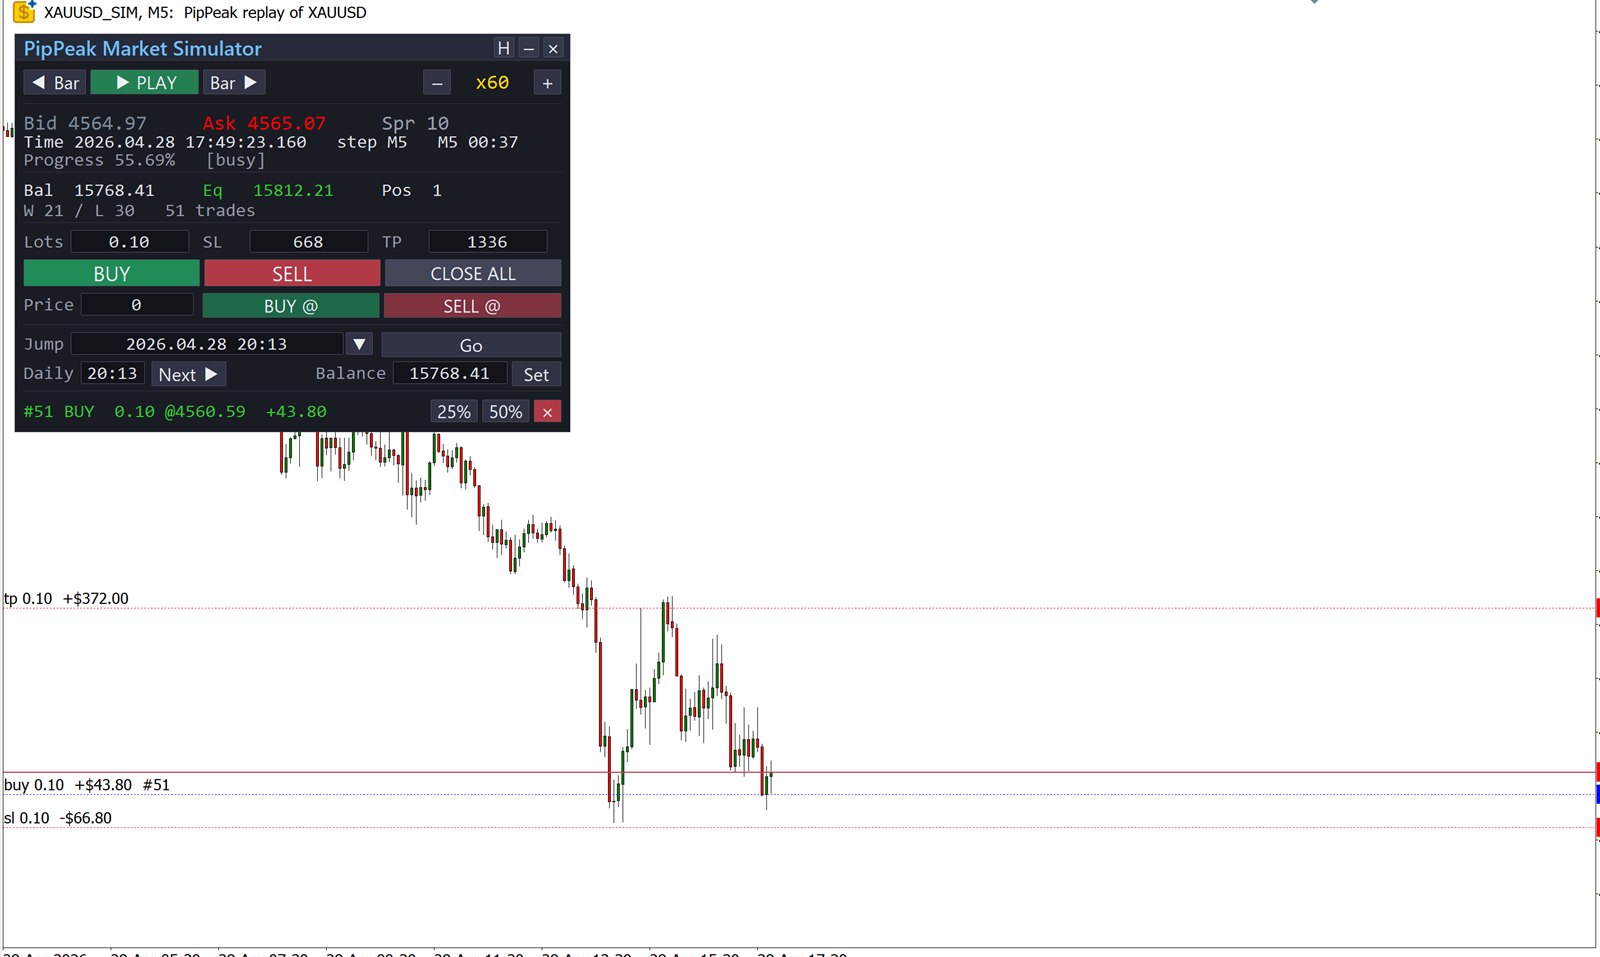
This is the founder's own practice sitting, recorded for the tutorial video on 12 October 2026 and shown here without selection: XAUUSD, 57 market days (2026-03-03 → 2026-04-28) replayed in 42 minutes at ×60, 47 closed trades, starting balance $10,000. Losses, a losing run and a 22% drawdown included — that is what a report is for. The report speaks to the trader who sat, as yours will speak to you.
The panel in the video counts 51 trades; this report counts 47 closed positions. The build in the video (1.58) counted a position closed in two parts as two trades; from 1.59 the panel counts positions, as the report always has.
Practice results — costs not modelled. Orders fill at the real quote of the tick that triggered them; no commission, swap, latency or added slippage is modelled, so every figure here is before costs and somewhat better than the same trades would be live.
Positions closed
47
Wins / losses
18 / 29
38% won
Net R (47 of 47)
+13.64R
+0.29R a trade
Net profit (before costs)
+$5768.41
Market days traded
25
1.9 trades a day
Deepest equity fall
22.0%
on the market clock, every tick
Running total, trade by trade
Every closed trade in R, in the order they were taken. This is the curve of the strategy — it does not depend on position size or on how fast the replay ran.
What the AI Coach said about this sitting
An excerpt of the coach's first analysis of the project, unedited. The coach reads every trade of a project and remembers it from one analysis to the next.
You're trading Gold as a swing trend follower and doing the hard parts well: 100% stop placement, 2.00 planned R:R, median winner 2.01R, and a typical winner keeping 100% of its best open profit. Edge capture of 90% means there is nothing to fix on the exit side of winners — stop reading advice about letting winners run. But this is a replay of historical data with no costs modelled, 14 undone events removed, and expectancy of +0.29R with a 95% interval of −0.34R to +0.92R. That range contains zero. Across 47 trades this is a hypothesis, not an edge — and a live version would print lower than $5,768.
Stop widening. You moved the stop further from entry on 12 trades, and 6 of 47 trades lost more than their planned stop, costing 3.93R beyond plan. Here's the problem: those widened trades netted +10.49R. The behaviour got paid. That is how a rule-breaking habit becomes permanent — you'll remember the rescues, not the 8.74R closed-trade drawdown or the 8-trade losing run you sat through. Median risk 2.59% per trade with an in-sitting equity drawdown of 22.0% means you do not have room for this to misfire twice.
Your own sitting, your own report
The simulator is free with a PipPeak account. The report is open to every plan; the AI Coach is metered.
Create a free account